Keywords: #ProcessImprovement #Bottleneck #HowTo #ProcessMining #QueueingTheory #LittlesLaw
The number of times an activity is used is contained in the event log. This is the Use Count. If you think the use count of Activities and Links can be different, you are right! In this article, we will discuss what is the Use Count Threshold and how to influence it using the Threshold Slider.
Visually Disconnected Activities
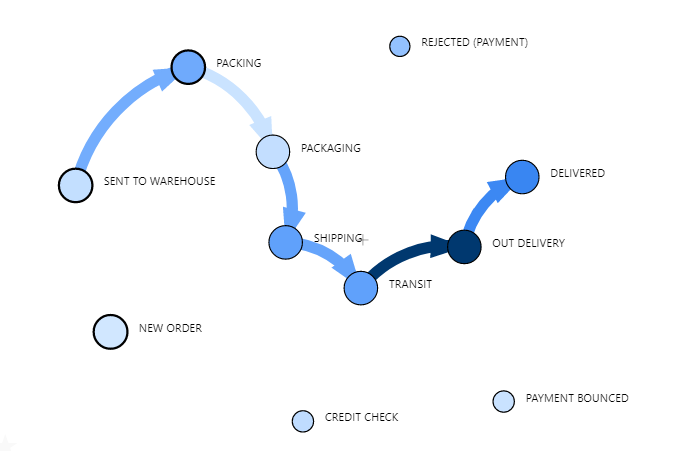
Have you noticed some floating activities? For example, the activities REJECTED (PAYMENT), CREDIT CHECK and PAYMENT BOUNCED are not joined to any other activities. You might be wondering why?
The floating activities are the result of the Threshold. This is a number which which hides links if the link’s use count fall under this threshold. For example, if the threshold is 20, then any link that is used less than 20 times is not shown.
Why is this important? Adjusting this threshold allows you to view a simplified version of the process.
Note: This is only implying less used links may be less important and not a concrete definition. You as the subject matter expert will be able to make this call.
The threshold is controlled by the Threshold Slider. Try sliding the Use Count Threshold slider to the far left.
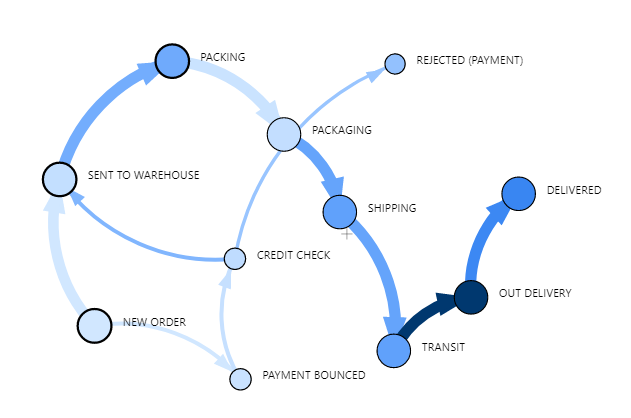
With a very low threshold (sliding to the left), you can see that all the floating activities are now connected to others. Conversely, if you slide the slider to the right, you are imposing a higher threshold which is a stricter rule in terms of what links to show.
In an ideal world, every event happens according to the process definition. However, in the real world, there will be exceptions, deviations and variants of the same process. This is really useful for removing noise which can be very common in event logs. You can use this slider to investigate an optimum set of events, or sometimes derive a simpler process by omitting less used activities.